
An Approach for Modular Crop Model Development
In this page, a description of one recommended modular approach is given along with an example in which a simple crop and soil water model have been programmed as modules, using FORTRAN. The soil water and crop growth modules have been greatly simplified to allow us to focus on the approach instead of the relationships used in the modules. Thus, the model should not be used for other purposes. A listing of the FORTRAN code and input data files are also provided in an Appendix. The modules and an executable file can be downloaded to allow those who are interested in the approach to become more familiar with it.

Schematic of an overview of the modular structure
Module Definition and Structure
Reynolds and Acock (1997) and Acock and Reynolds (1989) proposed design criteria and rules for a generic modular structure for crop models. These include:
- The modules should relate directly to real world components or processes that are common to all plants to be modeled.
- Modules should represent a separate disciplinary function.
- Input and output variables should represent measurable values;
- Communication between modules should be solely via the input and output variables; and,
- Modules should be validated independently of other modules.
These criteria have been used in the decision of what components of the model will comprise each module. Based on the first criteria, above, each module represents a physical function or process related to crop growth and consists of, as a minimum, a single FORTRAN subroutine, or a group of linked subroutines. These module processes are interdependent, but can be linked solely through a defined set of input and output variables, which are passed into and out of the modules as subroutine arguments.
The following guidelines, based on the approach of van Kraalingen (1995) and adapted by Kenig and Jones (1997) are proposed for the construction of modules. Each module should:
- Read its own parameters;
- Initialize its own variables;
- Accept variables passed to it from other modules and the environment;
- Pass variables that are computed within the module;
- Own its set of state variables;
- Compute rates of change for its state variables;
- Integrate its state variables;
- Write its own variables as output; and
- Operate when linked to a dummy test program.
Thus, all data input, initialization of variables, rate calculations, integration calculations and output of data related to a specific function are handled within a single module. Modules can be run as a stand-alone model, when linked to a main driver program.
A Simple Crop-Soil Water Model Example
A simple model is presented to demonstrate an approach for modular model construction. The program consists of four main parts: the main program, plant growth module, soil water balance module and a weather input routine. A listing of the source code can be found in Appendix A. Although this program is written in the FORTRAN language, the modular approach described herein could be used with other computer languages as well.
The algorithms used in the plant and soil modules in the example model were intentionally kept very simple and are useful only to demonstrate the modular approach. The model is not intended to be used to accurately simulate actual physical conditions.
The criteria for generic modular structure developed by Reynolds and Acock (1997) and the specific guidelines for construction of a module were used in the development of the modules for the simple crop model which is used as our example. For larger, more complex models, it may be difficult to decide on how many modules to create. A few relatively large modules, using the criteria and principles above; would allow separation of these major components so that each could easily be replaced by other modules similarly structured, with exact matching of input and output variables. However, some of the modules may be components of larger system models or they may be made up of smaller modules, each of which could have the same criteria applied. Thus, the determination of modules is, to some extent, arbitrary.
Figure 1 illustrates the modular format used in the simple CROP model, in which each module has two or more of the following five components:
- The ‘initialization’ section is used to input data and initialize variables and is called once per simulation.
- The ‘rate calculation’ section computes process rates and rates of change of state variables based on conditions at the end of the previous day of simulation. This routine is called once per time step of simulation.
- The ‘integration’ section updates state variables using the rates previously calculated.
- The ‘output’ section is called once per day to generate daily output reports.
- The ‘close’ section is called once at the end of simulation to close output files and generate summary reports.

Figure 1
The main program (MAIN.FOR) contains up to five calls to each module to accomplish the various components of processing. The dynamic flow of processing within the program is regulated with the DYN variable. Each module is called once at the beginning of simulation with DYN set equal to ‘INITIAL’, resulting in execution of the initialization portion of the module. During the daily time loop, each module is called three times: once each for rate calculation (DYN = ‘RATE’), integration calculations (DYN = ‘INTEG’), and for output of daily computed data (DYN = ‘OUTPUT’). A final call to each module is made to write summary output files and to close input and output files (DYN = ‘CLOSE’) after the simulation is complete.
The FORTRAN code used for directing calls to a module from the main program is presented in Figure 2. Figure 3 lists typical code used to control processing within a module.
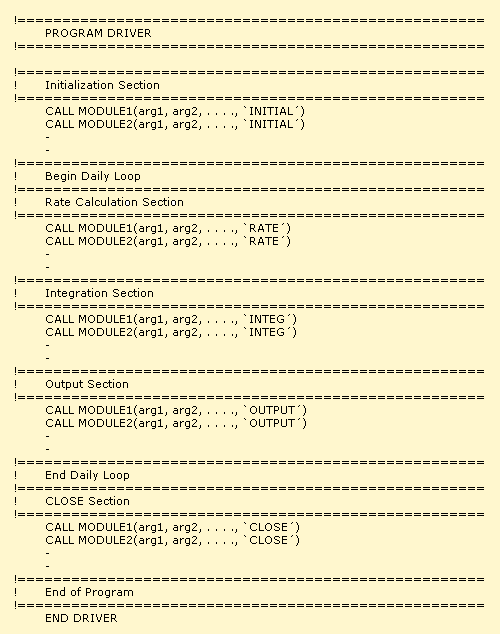
Figure 2. Module Processing within Main Program
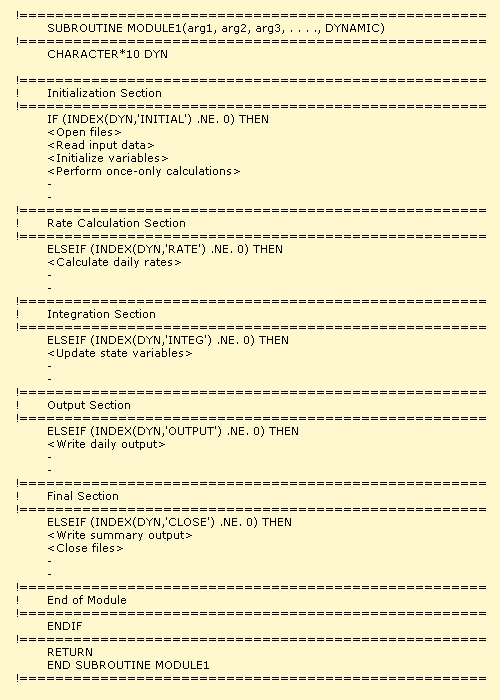
Figure 3. FORTRAN Code for Module Structure
In the example model, the main program calls the plant module, weather module and soil water balance module in turn to perform computations for each of the listed functions. Rate, integration and output sections are within the time step loop and the soil water and plant modules are each called three times per time step within this loop. The weather module is also called from within the time step loop, but only once per day in the rate calculations section.
The following sections detail the structure and content of the three modules which are included in this example model, i.e., the plant growth module, the soil water content module and the weather module.
Plant growth module (PLANT.FOR)
The plant growth module computes crop growth and development based on daily values of maximum and minimum temperatures, radiation and the daily value of two soil water stress factors, SWFAC1 and SWFAC2. This module also simulates leaf area index (LAI), which is used in the soil water module to compute evapotranspiration.
Initialization
Input variables, as listed in Table 1, are read from file PLANT.INP. File PLANT.OUT is opened and a header is written to this output file.
| Table 1. Input Data Read for Plant Module | ||
| Variable Name | Definition | Units |
| EMP1 | Empirical coefficient for LAI computation, maximum leaf area expansion per leaf | m2/leaf |
| EMP2 | Empirical coefficient for LAI computation | — |
| fc | Fraction of total crop growth partitioned to canopy | — |
| fl | Specific leaf area | m2/g |
| intot | Duration of reproductive stage | degree-days |
| lai | Leaf area index | m2/m2 |
| Lfmax | Maximum number of leaves | — |
| n | Leaf number | — |
| nb | Empirical coefficient for LAI computation | — |
| p1 | Dry matter of leaves removed per plant per unit development after maximum number of leaves is reached | g |
| PD | Plant density | plants/m2 |
| rm | Maximum rate of leaf appearance | leaf/day |
| tb | Base temperature above which reproductive growth occurs | °C |
| w | Total plant dry matter weight | g/m2 |
| wc | Canopy dry matter weight | g/m2 |
| wr | Root dry matter weight | g/m2 |
Rate calculations
The plant module calls three subroutines: PTS to calculate the effect of temperature on daily plant growth rate and rate of leaf number increase; PGS to calculate daily plant weight increase (g/plant); and LAIS to calculate increase in leaf area index.
In subroutine PTS, the growth rate reduction factor (PT) is calculated every day using the following equation:
![]() where TMIN and TMAX are the minimum and maximum daily temperatures, respectively. Subroutine PGS calculates PG, the potential daily total dry matter increase (g/plant):
where TMIN and TMAX are the minimum and maximum daily temperatures, respectively. Subroutine PGS calculates PG, the potential daily total dry matter increase (g/plant):
![]() where SRAD is the daily solar radiation (MJ/m2) and PD the plant density (plant/m2). Y1 is obtained by:
where SRAD is the daily solar radiation (MJ/m2) and PD the plant density (plant/m2). Y1 is obtained by:
![]() where ROWSPC is the row spacing in (cm). The potential plant growth rate (PG) is limited by soil water stress (deficit or saturation) through SWFAC and temperature through PT.
where ROWSPC is the row spacing in (cm). The potential plant growth rate (PG) is limited by soil water stress (deficit or saturation) through SWFAC and temperature through PT.
The plant cycle is divided in vegetative and reproductive phases. The vegetative phase continues until the plant reaches a genetically determined maximum leaf number (Lfmax). During the vegetative phase, leaf number increase (dN) is calculated based on a maximum rate (rm) and a temperature based limiting factor (PT).
During reproductive phase, di, the difference between daily mean temperature and a base temperature (tb), is used to calculate the rate of plant development. Total rate of development towards maturity is accumulated as int.
Subroutine LAIS is called for both phases to compute the change in leaf area index (dLAI). During vegetative period, LAI increases as a function of the rate of leaf number increase. The potential rate is limited by soil water stress (both deficit and saturation), through SWFAC, and temperature, through PT. Its value is given by:
![]() where PD is the plant density (plants/m2), EMP1 is the maximum leaf area expansion per leaf, (0.104 m2/leaf) and a is given by:
where PD is the plant density (plants/m2), EMP1 is the maximum leaf area expansion per leaf, (0.104 m2/leaf) and a is given by:
![]() where EMP2 and nb are coefficients in the expolinear equation and N is the development age of the plant (leaf number).
where EMP2 and nb are coefficients in the expolinear equation and N is the development age of the plant (leaf number).
After plant has reached the maximum number of leaves, LAI starts to decrease as a function of the daily thermal integral, di. The rate of decrease is given by:
![]() where p1 is the dry matter of leaves removed per plant per unit development after maximum number of leaves is reached and SLA is the specific leaf area.
where p1 is the dry matter of leaves removed per plant per unit development after maximum number of leaves is reached and SLA is the specific leaf area.
In the vegetative phase the assimilates are partitioned between canopy and roots (dwc and dwr) whereas in the reproductive phase all growth occurs in the grain (dwf). All whole plant weight increases (dw) are converted to area based values by multiplying by the plant density value (PD).
Integration
Changes to leaf area index (dLAI), plant weights (dw, dwc, dwr and dwf) and leaf number (dN) are integrated into the appropriate state variables (LAI, w, wc, wr, wf and N) at the beginning of the ‘integration’ section.When the accumulated value of the rate of development towards maturity (int) reaches a genetically determined value (intot), the grain is matured and the simulation is complete.
Output
Daily output is written to the PLANT.OUT file.
Close
The PLANT.OUT output file is closed.
Soil Water Balance Module (SW.FOR)
A single, homogeneous soil layer underlain by a relatively impervious layer is assumed for our example model. A simple water balance is used to update the soil water content on a daily basis using computed values of infiltration, evaporation, transpiration and drainage. The soil characteristics defined are soil water content at wilting point (WPp), field capacity (FCp) and saturation (STp) all in units of cm3/cm3; soil profile depth (DP in cm), daily drainage fraction (DRNp), curve number (CN) and initial soil water content (SWC_INIT in mm). The soil water module returns two parameters (SWFAC1 and SWFAC2) which express the effects of drought and excess soil water on crop growth rate. These factors vary from 1.0 (minimum stress) to 0.0 (maximum stress). In addition to soil characteristics and weather data, this module requires the value of leaf area index (LAI), which is computed in the plant module, to calculate potential evapotranspiration.
Initialization
In the ‘initialization’ portion of the code, input files SOIL.INP and IRRIG.INP and output file SW.OUT are opened. The required soil input data is read from file SOIL.INP and the file is closed. These input variables are listed in Table 2. Headers are written to output file SW.OUT.
| Table 2. Input Data Read for Soil Water Balance Module | ||
| Variable Name | Definition | Units |
| CN | Runoff curve number | — |
| DP | Depth of soil profile | cm |
| DRNp | Daily drainage percentage (fraction of void space) |
cm3/cm3 |
| FCp | Soil water content at field capacity (fraction of void space) |
cm3/cm3 |
| STp | Soil water content saturation (fraction of void space) |
cm3/cm3 |
| SWC | Initial soil water content in the profile | mm |
| WPp | Soil water content at wilting point (fraction of void space) |
cm3/cm3 |
Units for the soil parameters are converted from volumetric fractions to mm of water:
WP = DP * WPp * 10.0
FC = DP * FCp * 10.0
ST = DP * STp * 10.0
where WP, FC and ST are the wilting point, field capacity and saturation content in mm of water, respectively. Other variables are as defined in Table 2. Subroutine RUNOFF is called to compute soil storage capacity (S) based on the Soil Conservation Service runoff curve number method:
S = 254 * (100/CN – 1)
Subroutine STRESS is called to calculate the threshold soil water content below which drought stress will occur (THE). For our model, this is approximated as:
THE = WP + 0.75 * (FC – WP)
Initial stress factors (SWFAC1 and SWFAC2) are then calculated based on initial soil water content. This is discussed in more detail in Section 5.3.
Cumulative values of rainfall (TRAIN), irrigation (TIRR), soil evaporation (TESA), plant transpiration (TEPA), runoff (TROF), vertical drainage (TDRN), and infiltration (TINF) are set to zero for the beginning of the simulation.
Rate calculations
Irrigation rates are read from file IRRIG.INP. Potential infiltration (POTINF) is the sum of rainfall and irrigation. Cumulative irrigation and rainfall depths are summed to TIRR and TRAIN, respectively. Subroutine DRAINE is called to compute vertical drainage of soil water (DRN in mm) based on a daily fraction of the soil water content above field capacity:
DRN = (SWC – FC) * DRNp
If potential infiltration (POTINF) is greater than zero, subroutine RUNOFF is called to compute daily surface water runoff rates (ROF) using the SCS curve number method.
| IF (POTINF .GT. 0.2 * S) THEN ROF = ((POTINF – 0.2 * S)**2)/(POTINF + 0.8 * S) ELSE ROF = 0 ENDIF |
Infiltration (INF) is the difference between potential infiltration and runoff.
Subroutine ETpS calculates the daily potential evapotranspiration rate (ETp) based on the Priestly-Taylor method. The surface albedo (ALB)is estimated as a weighted average (based on LAI) of the albedo of the soil (0.1) and crop (0.2).
ALB = 0.1 * EXP(-0.7 * LAI) + 0.2 * (1 – EXP(-0.7 * LAI))
The average temperature during the day (T) and the equilibrium evaporation (EEQ) are calculated.
| Tmed = 0.6 * TMAX + 0.4 * TMIN EEQ = SRAD * (4.88E-03 – 4.37E-03 * ALB) * (Tmed + 29) |
The equilibrium evaporation rate is adjusted by a coefficient (f) resulting in the final value of ETp.
Next, the potential soil evaporation (ESp) and plant transpiration (EPp) rates are calculated using the same weighting coefficient used for albedo:
| ESp = ETp * EXP(-0.7 * LAI) EPp = ETp * (1 – EXP(-0.7 * LAI)) |
Subroutine ESaS calculates the actual daily soil evaporation rate (ESa) based on current soil water availability. No evaporation occurs if the soil water content is less than the wilting point, and the potential evaporation is met if soil water content is greater than field capacity. Between the wilting point and field capacity, the actual evapotranspiration varies linearly between 0.0 and the potential evapotranspiration rate.
| IF (SWC .LT. WP) THEN a = 0 ELSEIF (SWC .GT. FC) THEN a = 1 ELSE a = (SWC – WP)/(FC – WP) ENDIFESa = ESp * a |
The potential plant transpiration rate (EPp) is reduced by the minimum soil water stress factor (SWFAC1 or SWFAC2) to obtain the actual plant transpiration rate (EPa).
Integration
The integration portion of the soil water balance module updates the value of the soil water content based on the computed values of infiltration (INF), soil evaporation (ESa), plant transpiration (EPa), and vertical drainage (DRN):
SWC = SWC + (INF – ESa – EPa – DRN)
The computed value is limited to a maximum of the saturation content (ST) and a minimum of zero. If the computed soil water content exceeds saturation, runoff rates and soil water content are adjusted. An additional adjustment factor (SWC_ADJ) is introduced if the computed soil water content is less than zero.
Cumulative infiltration, evaporation, transpiration, drainage and runoff are then updated.
Subroutine STRESS is called to compute soil water stress factors based on the updated soil water content values. The drought stress factor (SWFAC1) is 1.0 (minimum stress) if the soil water content (SWC) is greater than the threshold value computed in the ‘initialization’ section (THE). Below the wilting point, maximum stress occurs (SWFAC1 = 0.0). Between these ranges, the stress factor is linearly distributed.
| IF (SWC .LT. WP) THEN SWFAC1 = 0.0 ELSEIF (SWC .GT. THE)THEN SWFAC1 = 1.0 ELSE SWFAC1 = (SWC – WP) /(THE – WP) SWFAC1 = MAX(MIN(SWFAC1,1.0), 0.0) ENDIF |
The thickness of the water table measured from the bottom of the soil profile (WTABLE in mm) is calculated using the excess water available after field capacity is met. The depth to the water table (DWT in mm) is then computed.
| WTABLE = (SWC – FC) / (ST – FC) * DP * 10. DWT = DP * 10. – WTABLE |
Minimum excess soil water stress (SWFAC2 = 1.0) occurs when the water table thickness is zero. Maximum stress (SWFAC2 = 0.0) occurs when the depth to the water table (DWT) is greater than 250 mm (STRESS_DEPTH = 250 mm). The excess water stress factor is linearly interpolated between these water table conditions.
| IF (DWT .GE. STRESS_DEPTH) THEN SWFAC2 = 1.0 ELSE SWFAC2 = DWT / STRESS_DEPTH ENDIF |
Output
Daily values are written to output file SW.OUT.
Close
At the end of simulation, Subroutine WBAL is called to check that the seasonal water balance is zero, i.e., that changes in soil water content are equal to cumulative inflows and outflows. A water balance report is written (WBAL.OUT). Files SW.OUT and IRRIG.INP are closed.
Weather module (WEATHR.FOR)
The weather module is called three times from the main program for initialization, rate calculations and to close files. Upon initialization, the weather file is opened. In the rate calculations section, weather values are read into the model on a daily basis from file WEATHER.INP. Table 3 lists the weather input data read. The close section is invoked to close the weather input file.
| Table 3. Input Data Read for Weather Module | ||
| Variable Name | Definition | Units |
| DATE | Julian date in YYDDD format | — |
| PAR | Daily photosynthetically active radiation | mo1[photon]/m2-day |
| RAIN | Daily rainfall | mm |
| SRAD | Daily solar radiation | MJ/m2 |
| TMAX | Daily maximum temperature | °C |
| TMIN | Daily minimum temperature | °C |
Downloads
Modular Approach Report (PDF) Example FORTRAN90 codes used in this post
References
- Acock B., and Reynolds J.F., 1989. The rationale for adopting a modular generic structure for crop simulators. Acta Horticulturae 248:391-396.
- Kenig A., and J.W.Jones, 1997. Model structure for dynamic crop-greenhouse simulations. In: Seginer I., J.W. Jones, P. Gutman, and C.E. Vallejos (eds), Optimal environmental control for indeterminate greenhouse crops. Final Report, BARD Research Project IS-1995-91RC, Agricultural Engineering Department, Technion, Haifa, Israel. Chap. II-4.
- Kraalingen, D.W.G. van, 1995. The FSE system for crop simulation, version 2.1. Quantitative Approaches in Systems Analysis Report no. 1. DLO Research Institute for Agrobiology and Soil Fertility, Production Ecology, Wageningen.
- Reynolds, J.F. and B. Acock. 1997. Modularity and genericness in plant and ecosystem models. Ecological Modeling 94: 7-16.